
The building operator at 2am, alone with eight systems reporting, needs to know in one glance whether she can go back to sleep.
Connected Buildings -
Autonomous Digital Twin
A reimagining of how facility managers, engineers, and operations leaders understand the buildings they’re responsible for.
01 - THE PERSON
SARAH
Forty-two years old. Fifteen years managing building systems. She knows her building the way a musician knows their instrument — which AHU runs hot in August, which floor’s controls were rebuilt last year and which were never touched, which alarm at 2am is the one that means get out of bed.
What she could not do — what the tools never let her do — was see her building. Not the floor plan. Not the schematic. The building as it actually behaved.
“I know Floor 8 has high energy consumption. But I have no idea which part of the floor, or which equipment, is causing it.”
She was not the only one carrying this.
The Building Engineer spent 20 minutes answering a question that should have taken 20 seconds — “how many VAVs do we have in the executive offices?” — because the answer lived in three different systems and required him to remember asset IDs by heart.
The Operations Manager spent more time in executive briefings explaining the data than showing the insight, because the data had never been built for someone above the floor.
Three roles. Three different versions of the same weight: the building was a thing that demanded to be decoded before it could be managed.
02 - THE BRIEF, AND WHAT WAS UNDERNEATH IT
What we were asked to build vs. what the project actually controlled.
The brief was a dashboard. A better one — clearer KPIs, faster navigation, less switching between tools. That was the 100K: real, deliverable, defensible in a sprint review. The kind of brief that ships and gets a usability bump and earns a satisfied nod from the customer.
But the brief was not the real question.
The real question was the one Sarah asked, without asking it, every time she opened the existing tools at 2am: “Why am I being made to decode a building I already know?”
A better dashboard would have answered the brief. It would not have answered her question. That gap between them — between the deliverable and the desire underneath it — was the 600K.
The 100K was the milk. The 600K was what I found when I checked the fridge.
So before I drew a single wireframe, I wrote the Leverage Brief. Not what we were building. What it controlled if the vision held all the way through:
- Sarah stops decoding her building and starts navigating it.
- The engineer’s 20 minutes becomes 20 seconds — and his expertise gets to live in the work, instead of disappearing under it.
- The operations manager walks into the executive briefing carrying a story instead of a spreadsheet.
- The building stops being something the team tolerates and becomes something they have a relationship with.
That was the 600K. That was what this project actually controlled, if I refused to lose it.
Team and Timeline Overview
Garry Kapoor
Connected Buildings
Prabhat Ranajan
Chief Technology Officer
7 Weeks
Timeline
03 - WHAT WE FOUND
Observation, contextual inquiry, and the pattern that named the real problem.
I conducted interviews, on-site observation, and workflow mapping with facility managers, building engineers, and operations leaders across multiple buildings. The patterns were consistent enough that they stopped being patterns and became one diagnosis:
- 7–12 clicks to reach a single insight
- 3–5 tools open simultaneously to answer one question
- Asset IDs memorized, because the system that named them didn’t help you find them
- Reporting taking hours, every week, because the data lived in places that did not speak to each other
- Executive briefings glazed over, because the data had never been built for the room it would be shown in
But the biggest insight was the one that changed the project:
“Users weren’t struggling because they lacked data. They were struggling because the data wasn’t connected to the real, physical space they worked in.”
The building was right there. They walked through it every day. The tools had simply never let the building be the way you found anything in it.
So I reframed the brief — not in language for the stakeholders, but in language for myself:
“What if Sarah could explore her data the same way she walks through her building? What if the system could be asked questions in plain English — and answer in the language of the space itself?”
Instead of forcing people to think like software, we let the software think like people.
04 - HOLDING THE VISION
The rebellion was quieter than argument.
When I brought the 600K version of this project to the room, the resistance wasn’t disagreement. It was something subtler — they couldn’t see it. The 3D, spatial, conversational version of building management existed only in imagination — mine, and the imagination of anyone who had truly felt what Sarah needed at 2am.
Every design project has a 0% period. It’s called the kickoff meeting. The budget is approved. The whiteboard is blank. When the designer pitches the 600K, everyone nods. And then the pressure arrives — and someone reasonable puts the schematic on the table. The dashboard. Let’s just ship the dashboard. We can do the rest later.
When teams lose a vision, they don’t notice immediately. The experience simply becomes reasonable instead of transformative.
I held this one through building. Not through argument. Every iteration moved the invisible picture one step closer to visible. Every prototype was a small piece of evidence that the 600K version was not a fantasy — it was a few weeks of work away from being something the room could feel.
The rebellion was not in refusing to do the assigned work. The rebellion was refusing to let the assigned work be a dead end.
05 - DESIGN PRINCIPLES
Five principles I held the work against, every sprint.
Spatial before symbolic. Show data where it lives — in rooms, on floors, inside the asset itself. If the user has to translate a number back into space, we’ve already lost time.
Plain language, not menus. Sarah can describe what she wants to know in one sentence. The system should be able to answer it in one sentence. Anything in between is friction that does not serve her.
Progressive depth. Building → floor → room → asset. Each level reveals only what matters at that level. The depth waits for the user, not the other way around.
Anomaly before alert. The system should surface what is unusual before it becomes an emergency — and surface it to the person who can act on it, not to the executive layer above them. Who sees this first determines what it means.
The building, not the dashboard, is the interface. The screen is a window into the building. If the screen ever becomes the thing the user is managing instead of the building, we’ve designed the wrong product.
06 - WHAT WE BUILT
Six surfaces, each one a moment in Sarah's day.

Building view
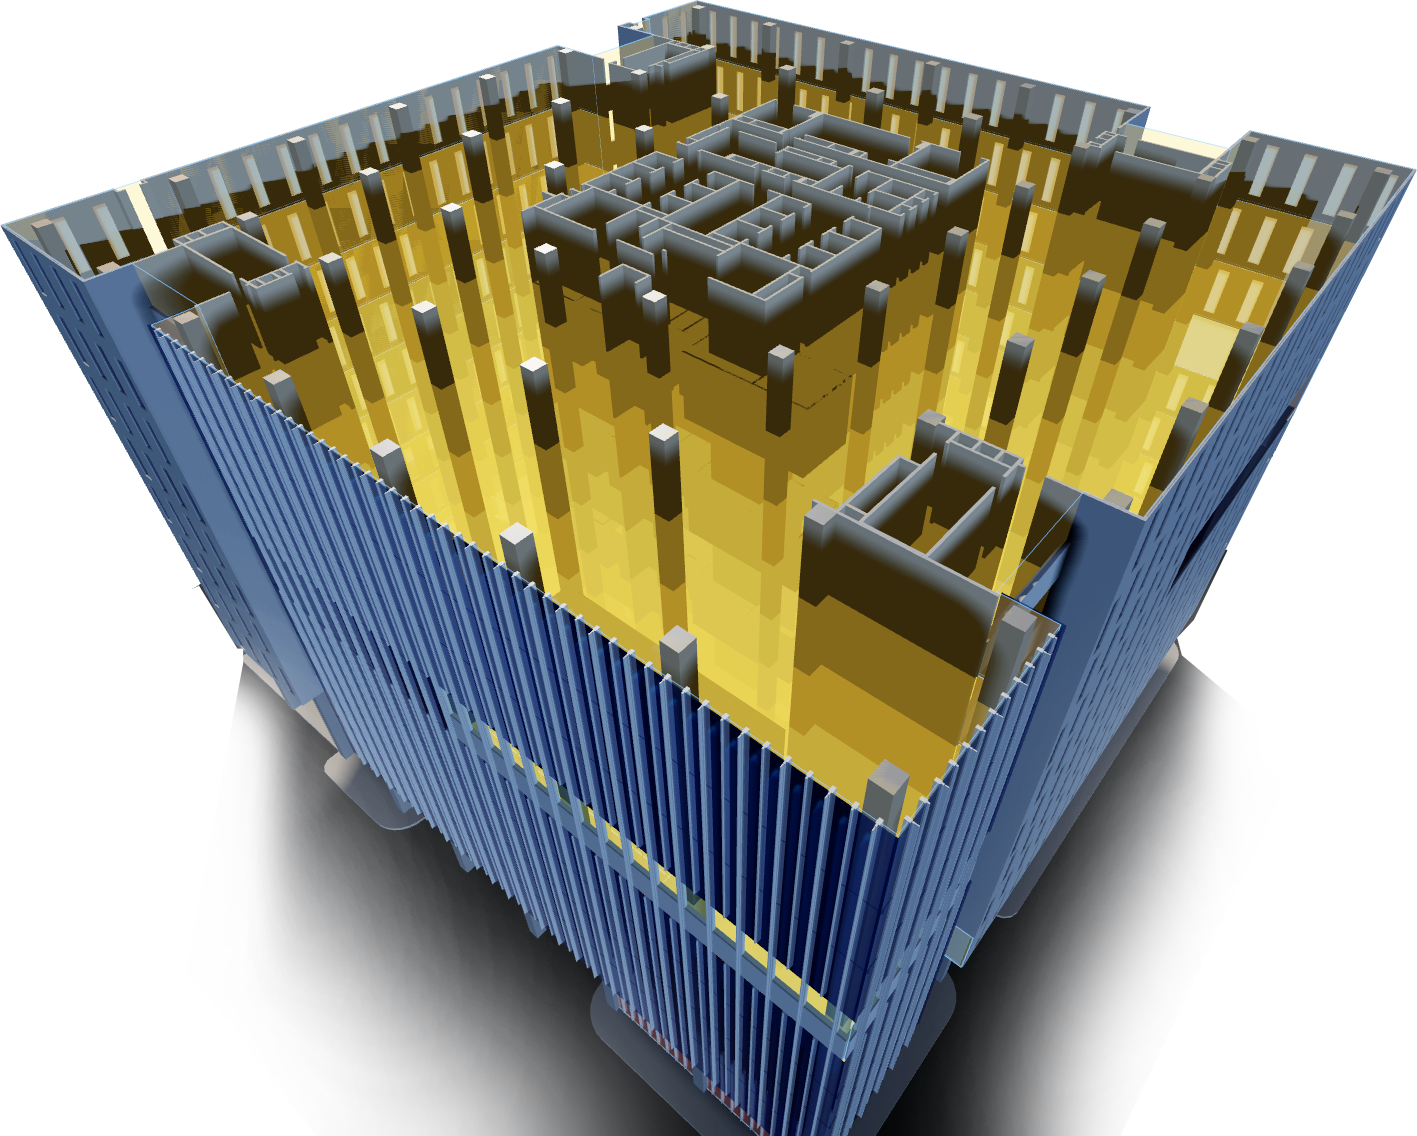
The campus, alive. Sarah opens the application and sees her building the way she sees it when she walks the perimeter. Energy performance overlays the structure itself, in color and motion, so anomalies are visible before they’re named.

Energy performance
Floor 8, identified in seconds. The high-consumption area Sarah used to spend an afternoon locating now appears as a hot zone the moment she opens the floor. The data isn’t a number anymore. It’s a place.

Conversational interface
Ask in English. “How many VAVs in the executive offices?” The system understands the question, finds the assets, and answers — in the language Sarah would have used with another operator standing next to her.

Future simulation
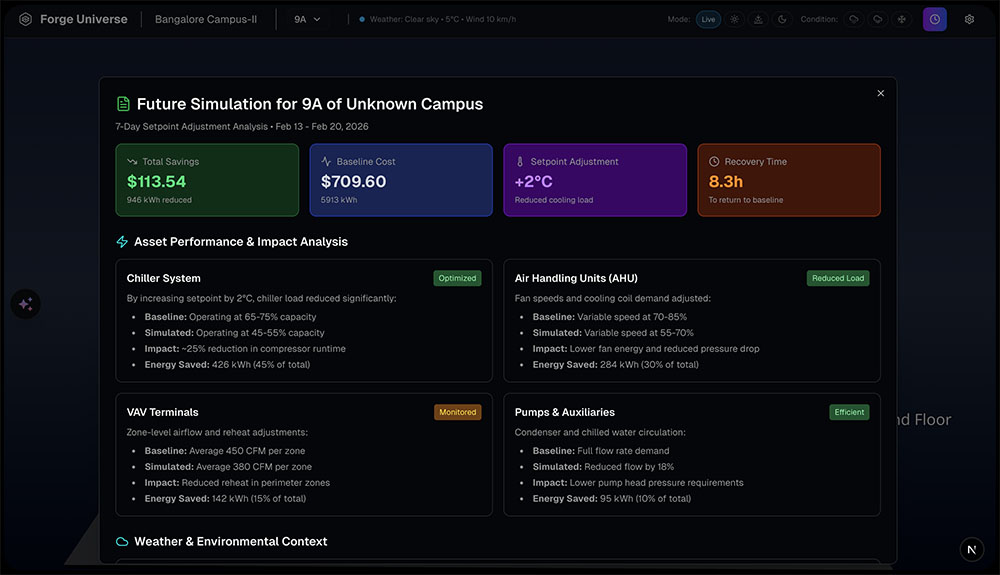
What happens if? Sarah can model a setpoint change, a schedule shift, an equipment failure — and watch the building respond in simulation, before she touches the real one.

Service cases
Anomaly to action. When the building flags an issue, the system surfaces it to the right person first — Sarah, then the engineer, then up — in an order that protects their work and their judgment. Who receives the insight first determines what it feels like when it arrives.
Reporting
The story, ready for the room. The operations manager no longer assembles the briefing. The briefing is already there — a narrative the executive can read, the engineer can defend, and the operator can recognize as the building they actually run.
07 - THE MOMENT
We put the Digital Twin in front of Sarah for the first time.
Not a stakeholder. Not a demo audience. A building operator — fifteen years of expertise in her hands, two decades of being given tools that treated that expertise as irrelevant.
She moved through the virtual building. Saw the anomaly before it surfaced as an alert. Ran the simulation. Saw the outcome. And then she went quiet.
“This is what I always needed. I just didn’t know it existed.”
That sentence is the case study. Everything before it is the work that made it possible.
08 - THE LEARNING
WHAT THIS PROJECT TAUGHT ME
The 600K is never the bigger version of the 100K. It is a different question altogether — one the brief was never written to ask. The job of the designer is not to deliver the 100K and then also try to find time for the 600K. The job is to make the 600K visible from the first sprint, so that every decision the team makes downstream is a decision toward the version of the product the user will recognize as the one they always needed.
Bring the milk. Always.
But never come home without checking the fridge first.